


Google Analytics passed its 10th birthday in October 2015 and is now used by more than 10 million websites worldwide. Here’s 10 small tips that will help you get the most of the reports and data available within Google Analytics- a tip for each year that Google Analytics has existed!
1. Segment data by source to assess what aspect of your marketing needs to improve
Segmentation of data allows you to easily compare how different sets of users are behaving once they land on your site. For example, if you know that Organic Traffic spend more and return more often than traffic from Social Media, your insight will be that that you should focus on your search engine optimisation (SEO) in order to increase the number of Organic visitors.
In order to segment any data, you click on the ‘All Sessions’ box at the top of the page:


You then have the option to select how you want to segment your data. You can choose to only see Paid, Organic or Direct Traffic; Mobile or Desktop Traffic; New or Returning Visitors or many more default options. You can also create your own segment if you don’t see the option there:

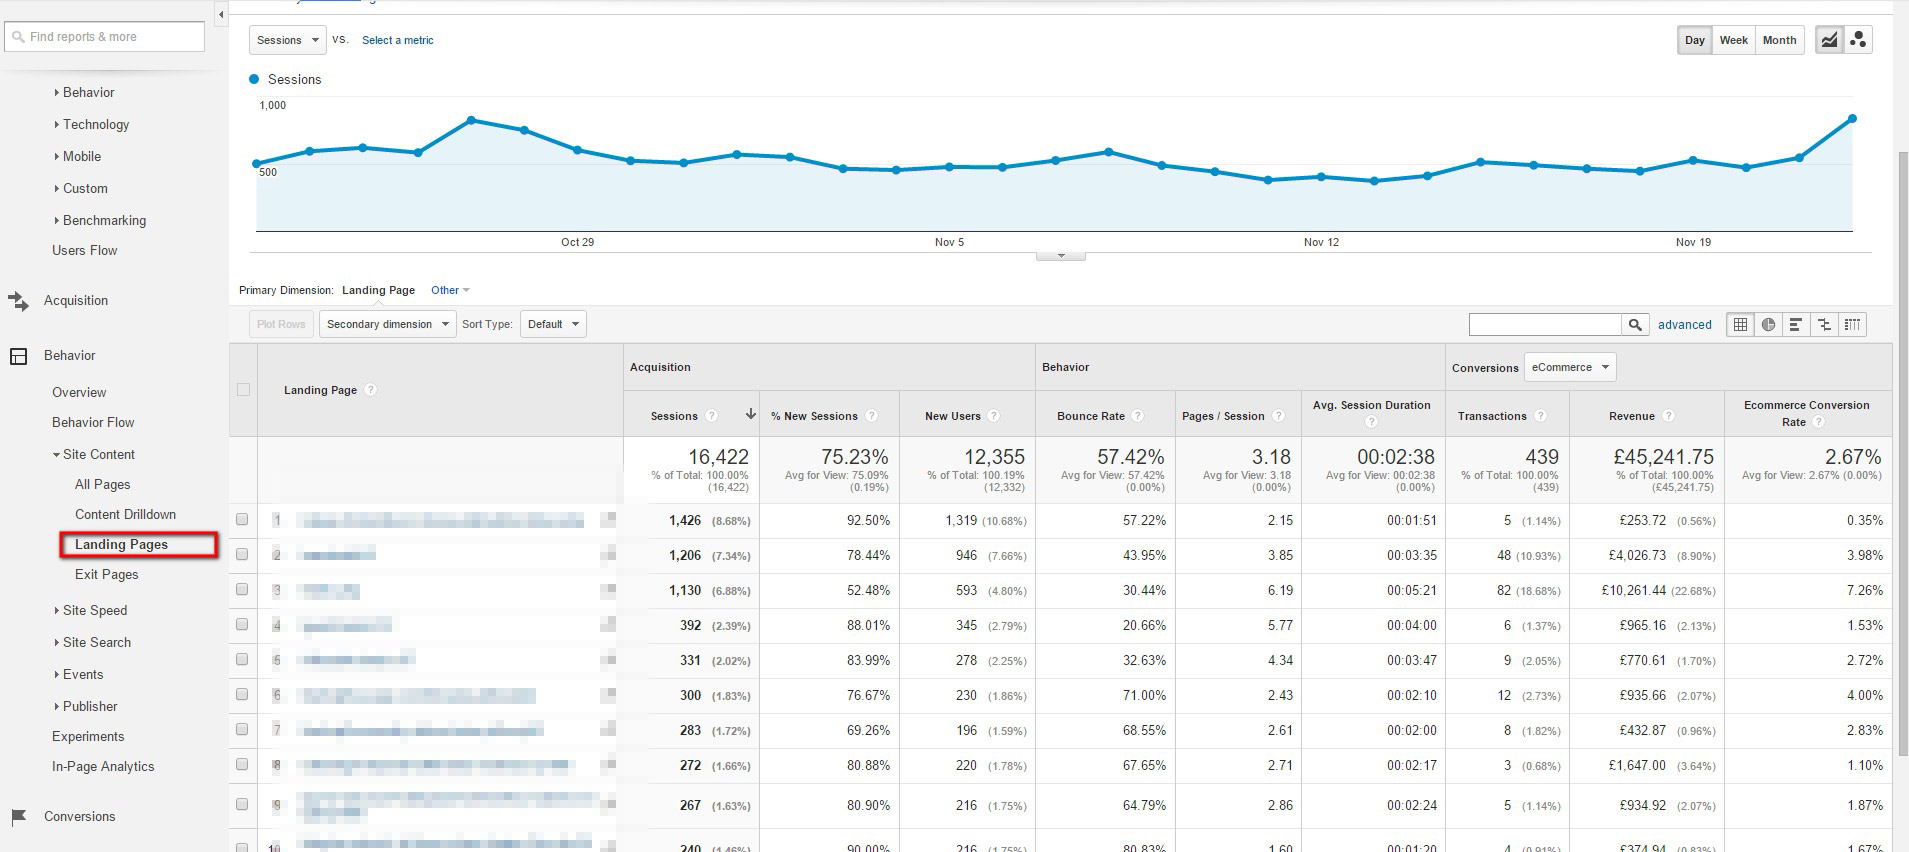
2. Highlight your Top Performing Landing Pages/ Exit Pages
You can use this report to examine which pages on your site are most effective at pushing conversions. This can impact upon where you decide to send your traffic during paid campaigns or social media posts.
This report is found under Behaviour > Site Content > Landing Pages:
You can also see a similar report, which shows where your users exit your website. Ideally the top exit page should be the confirmation of a completed conversion page (this could be a completed contact form or a completed sale). If you notice that other pages are experiencing a large spike in exits, you will need to investigate what might be causing this and implement steps aimed at reducing the number of exits (known as ‘leaks in your website’) throughout the user journey through your website.
This report is found under Behaviour> Site Content > Exit Pages:

3. Figure out your Top Conversion Paths
With the Top Conversion Report, you can see the journey that your customers most often take to your website on the way to a completed conversion. This will give you an idea of which channels are most effective at driving or assisting conversions, and how many visits to the website it takes for a user to convert. In the example below, you can see that the top conversion path is through Paid Traffic, then a second visit directly, followed by organic traffic then a second visit through directly typing in the URL. Therefore, you can tell that many users need to visit the site twice before a purchase and that they get to the site directly most often after seeing an ad or organic listing. This will show you the importance of retargeting to users in order to make sure that they arrive at your website for that second visit.
This report can be found Under Conversions > Multi-Channel Funnels > Top Conversion Path

4. Use UTM tracking to evaluate individual campaigns and social posts
![]()
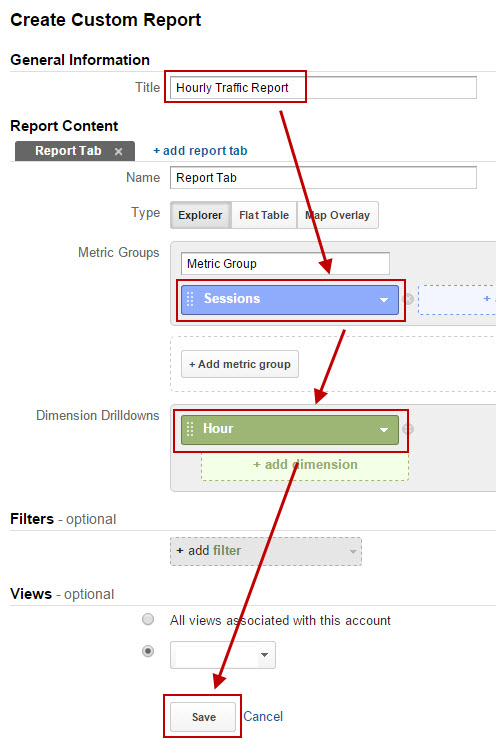
5. Highlight the time of day most users are converting on your website
This is a custom report, that is not present by default in Google Analytics. However, it is a very simple report to set up and gives you very valuable insights into your user behaviours, which will give you insight into your site’s busiest times and affect when your optimum time for promotions or adverts would be.
Many websites have busy periods during the day. You may see spikes in traffic just before school or work in the morning (7am to 9am), during lunchtime (12pm to 2pm), and right after school or work (4pm to 6pm).
Saying that, some websites will experience peaks of traffic throughout the day depending on the content they publish and the audience they target. For example, a children’s website will be quiet at night, while a B2B website will be much busier during business hours.
As with a lot of statistics from Google Analytics, we cannot tell unless we dive in to the data. Follow the steps below to create a 24 hour traffic report:
Make sure to pick a large date range in the top right corner. The more data you have, the clearer the results will be in the hourly report:
![]()
We now can see a graph and a data table with the count of sessions throughout the day:
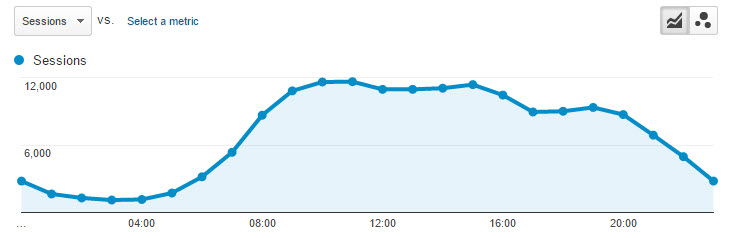
Use this graph to identify the peak times of the day when the website receives traffic. If the peak is just before midnight, then consider adding a special offer on the website that ends at midnight to create a last minute rush of sales. If the peak is around lunchtime, then make sure to promote the website heavily around 11am, just before lunchtime, to draw in the biggest number of visitors.
If you have goals and/or ecommerce tracking setup on the website, then this can give you valuable insights on what time the website converts best, independent of traffic levels. Follow the steps below to create a 24 hour conversion rate report:
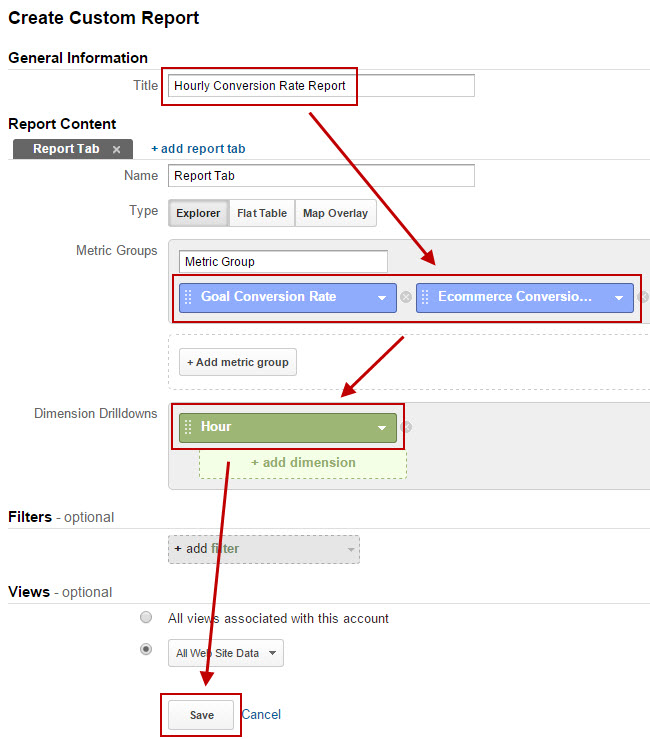
Again, ensure you pick a large date range in the top right corner once the report has run.
Now you can see how well the website performs from completed conversions, at different times of the day. You can switch between manually set up goals or e-commerce conversions (if you have e-commerce tracking implemented). This can be especially useful when adding bid adjustments on PPC campaigns to boost profitability. This report can highlight the exact times to ramp up efforts on both fronts to capture as many visitors as possible during times when they are likely to convert.
You can also see the average order value at different times of the day. The effectiveness of the website during the day not only counts on how well the website converts at different times, but also the average amount people spend during those times.
6. Discover the biggest selling products on your website
Google Analytics can tell you what specific products are selling well on your site, if you have E-Commerce Tracking turned on. The Product Performance Report can be found at Conversions > Conversions > E-Commerce > Product Performance.
This highlights sales that come through the website and is easily comparable to products sold through any other channels (e.g. an offline shop) to make decisions about what stock should be continued to be sold by the company.

7. Evaluate your location data, in order to determine where your resources are best focused on or where you can improve
With Google Analytics, one of the more standard reports is the Location report, which tells you where your users are coming from, which can set to country, city or region level. This is an excellent report to inform you of where you should be targeting resources to get the best return on investment. For example, if you can see that all of your conversions are coming from UK and Ireland, such as in the example below, the bulk of your advertising budget should be aimed at these areas. It can, however, also be good for testing new geographic markets, by spending an allocated budget on some ads and measuring the impact on performance from a specific targeted location.
For example, from the report below, if I wanted to maximise my return I would focus my advertising on UK and Ireland, which is where all my conversions have come from. However, if I wanted to test the USA market, I would spend a small budget targeting that area and measure carefully the change in bounce rate, pages/sessions and conversion rate to see if my website is useful to users from USA:
8. Identify issues with specific browsers
Many businesses make the mistake of only testing browsers that are available to them in the office. This can mean that you miss glaring conversion killers that only appear on specific browsers or devices. Within Google Analytics, you have access to a device or browser report, which will show you invaluable information about how the user experience varies on difference devices or different browsers.
For example, if you have a high bounce rate on one particular model of phone, it could be highlighting that your website, or certain pages of it, is not compatible with that one particular model. The 3 stats to look at for this report are: bounce rate, time on site and conversion rate. This report has allowed us in the past to identify issues with a client’s website, which wasn’t rendering properly on a Galaxy S5 phone, but working fine across other devices.
This report is found in the Audience report section, where you go to Technology>Browser & OS to view the data by browser, or Mobile > Devices to view the data by device.
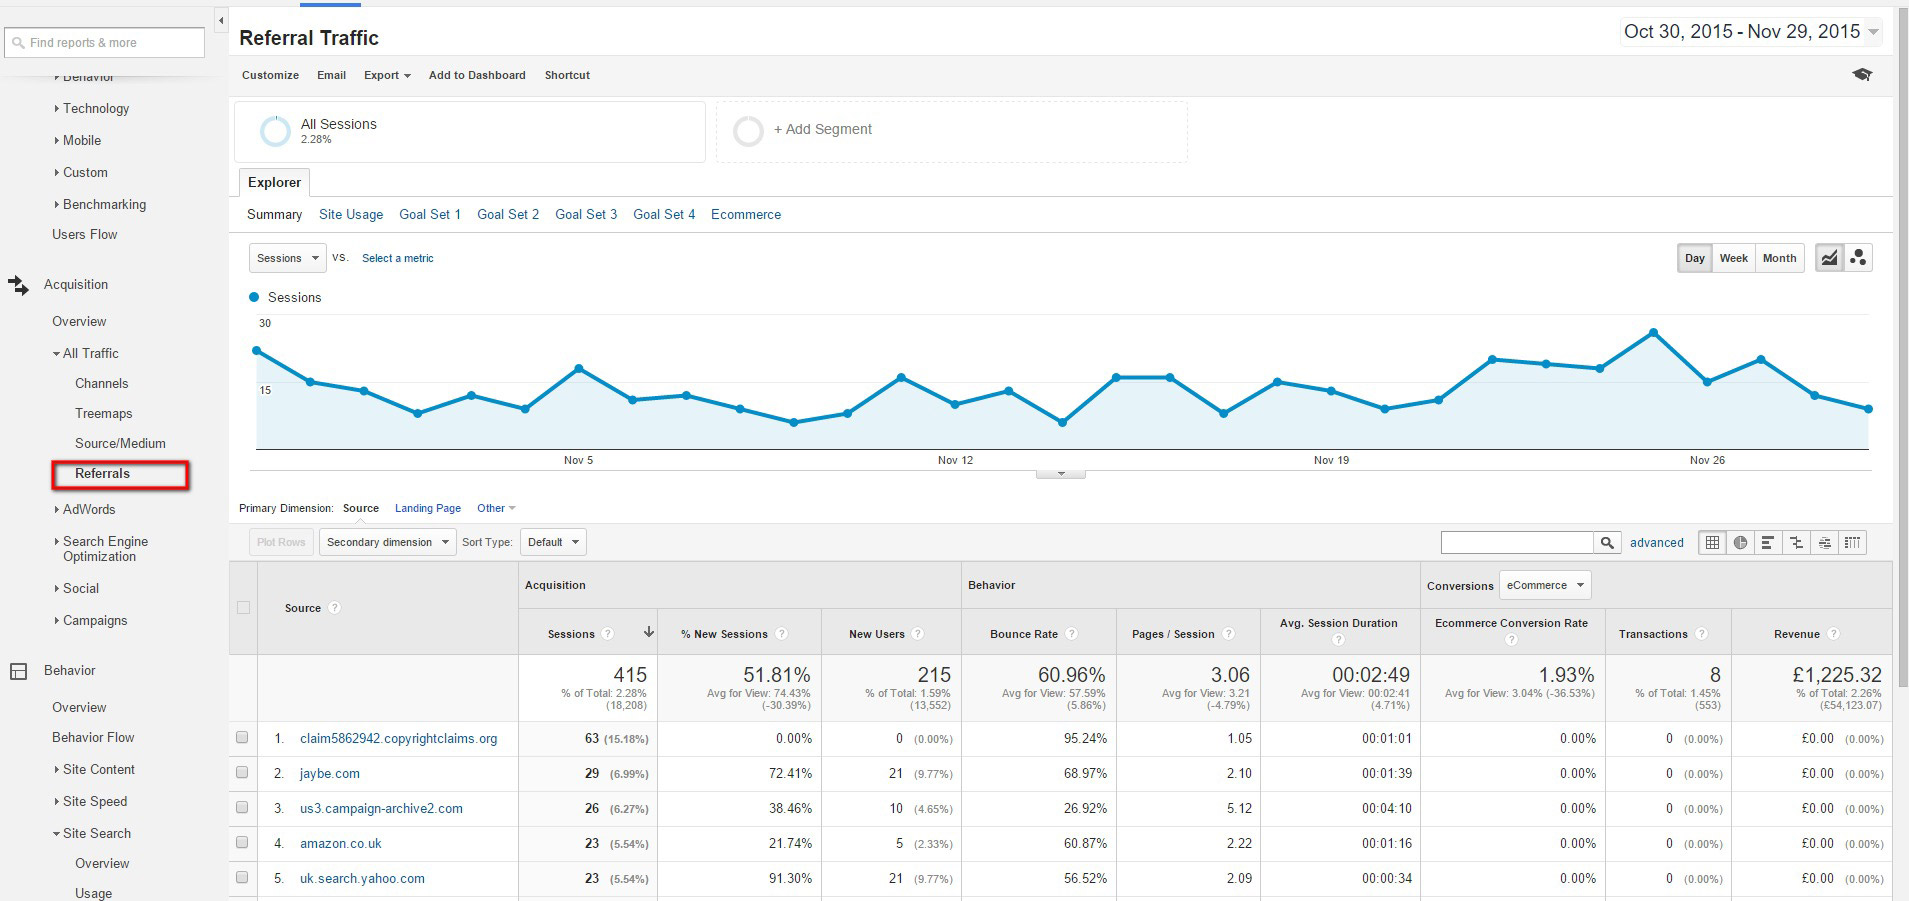
9. Discover your top referrers and most profitable links
When you are generating links, you may ask how relevant is the traffic that is being directed to your website. With Google Analytics, you can quantify this, with the Referrals report. This will show you the quantity of users coming from each third party link to your website and detail how they behaved upon landing, with stats such as bounce rate, time on site, number of conversions and most importantly, conversion value (although be aware that you will need to have e-Commerce tracking set up for this stat to work).
This report is found within Acquisition > All Channels > Referrals and looks like this:
10. Find out what your users are searching for and what is missing from your website
The Site Search report is an excellent report, which tells you what users are searching for when they land on your site. This report shows you what your customer needs from your website, in their own words. Its acts as a critical part of your market research and shows exactly where your website might be missing out on extra sales.
This report is found within Behaviour > Site Search > Overview and looks like this:
The report requires a slight bit of manual setup, which is done through the Admin section.
Under the view Settings, you click on site search, and hit the toggle button to ‘ON’. Underneath this you need to direct Google Analytics to what your query parameter starts with (this can be found in the URL of your search results page e.g. http://example.com/search.php?q=hello+world would have the query parameter of ‘q’).
If you have any questions about any of these tips or how to best implement Google Analytics on your site, drop me a line at ash@searchscientist.co.uk or give us a call at 02890683790.
No comments yet.